인공지능
[인공지능] 이미지 Classification confusion matrix로 분석하고 heatmap으로 시각화하기 : 실제값이 레이블 인코딩, 예측값이 softmax값일때
오늘은 집
2021. 12. 1. 11:47
학습이 다 끝난 상태에서! 시작해보자
0.기본 준비
from sklearn.metrics import confusion_matrix
1. 예측값의 각 행의 최대값 인덱스를 변수에 저장하자!
y_pred = model.predict(X_test)
y_pred_labels = y_pred.argmax(axis=1)
2. confusion matrix를 그리자!
cm = confusion_matrix(y_test, y_pred_labels)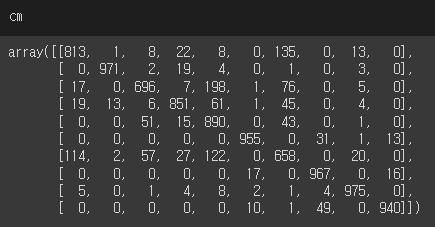
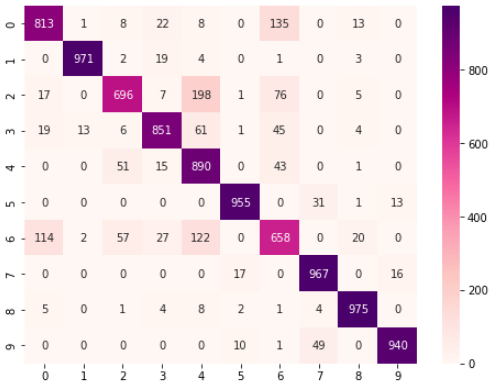
3. confusion matrix를 heatmap으로 시각화하자!
import seaborn as sb
sb.heatmap(data=cm, annot = True, fmt = '.0f', cmap='RdPu')
plt.show()